
Track schedule adherence, fill rate, overtime rate, no-show rate, open-shift percentage, labor cost as a percent of revenue, schedule creation time, and employee satisfaction. Start now by instrumenting adherence at 15 to 30 minute intervals and baselining three to five of these KPIs for the next 30 to 90 days before you touch a single scheduling rule.
TL;DR:
- Tracking adherence at 15 to 30 minute intervals provides more accurate insights into schedule gaps than daily averages, helping identify peak failure times.
- Baseline your chosen KPIs with 30 to 90 days of historical data to set realistic, operation-specific goals instead of blindly following industry benchmarks.
- An increase in overtime rate or open-shift percentage often signals forecasting or staffing issues that require immediate adjustment before costs or coverage problems worsen.
- Employee satisfaction signals, such as increased swap requests, are early indicators of scheduling friction that should be acted on quickly to prevent turnover.
- Using AI scheduling platforms speeds up KPI baseline building, enforces rules automatically, and improves data accuracy, but human approval remains essential to control quality.
Table of Contents
- What Are the Core Employee Scheduling KPIs?
- Where Reliable KPI Data Actually Comes From
- How to Set Realistic KPI Targets
- What to Do When a KPI Signals Trouble
- A 30-Day KPI Rollout Using an AI Scheduling Platform
- Industry-Specific Variations in Scheduling KPIs
- How Employee Satisfaction Shapes Your Scheduling Numbers
- Where Predictive Analytics Fits Into Scheduling KPIs
- Connecting Scheduling KPIs to Business Performance
- Common Pitfalls and a Week-1 Checklist
- Baseline Your KPIs in Days, Not Quarters
- Sources
What Are the Core Employee Scheduling KPIs?
You can't fix what you don't measure, and most workforce managers measure the wrong things. Coverage looks fine on paper while overtime quietly eats the budget. Here's what each core KPI actually tells you, how to calculate it, and what a bad number looks like.
Schedule adherence measures how closely staff follow the shifts they're assigned. The formula is straightforward: (time spent in scheduled state ÷ total scheduled time) × 100. This is the operational bridge between planned schedules and actual staffing, and it's the single most diagnostic number in your dashboard. Mature operations often target adherence in the 90 to 95% range, while anything under 85% usually signals real problems with either the schedule itself or how it's being followed.
Schedule fill rate (coverage) tells you what percentage of required shifts actually have a person assigned. Calculate it as (filled shifts ÷ total required shifts) × 100. A combined view of coverage against real demand catches overstaffing that a simple fill-rate number will never show you.
Overtime rate is overtime hours divided by total hours worked, times 100. To see the financial bite, multiply overtime hours by the overtime pay differential (usually time-and-a-half) and compare that total against your baseline labor budget. A rising rate of overtime compared to total hours in most hourly operations is worth investigating before it becomes a line-item problem.
No-show/call-out rate equals (unplanned absences ÷ total scheduled shifts) × 100. This one predicts your open-shift and overtime numbers almost perfectly, since every no-show creates a coverage gap someone else has to fill, usually at a premium.
Open-shift percentage and time-to-fill track how many shifts go unclaimed and how long they stay that way. Open-shift percentage is (unfilled shifts ÷ total shifts) × 100; time-to-fill is the average hours or days between a shift opening and it being claimed.
Labor cost as a percent of revenue divides total labor cost by revenue for the same period. Separating direct labor from management overhead in this calculation matters, because a rising ratio driven by management headcount tells a completely different story than one driven by front-line hours tied to sales volume.
Schedule creation time is simply the hours a manager spends building, adjusting, and publishing the week's schedule. Most managers underestimate this until they log it for a week.
Employee schedule satisfaction is harder to formula-ize but easy to track through swap requests, shift giveaways, and a short quarterly survey.
One composite metric worth adding to your dashboard: Overall Labor Effectiveness (OLE), calculated as Availability × Performance × Quality. It won't replace the KPIs above, but it works well as a diagnostic that flags whether a schedule problem is really a training or staffing-mix problem in disguise.
Where Reliable KPI Data Actually Comes From
Your KPI numbers are only as good as the systems feeding them. Four sources cover most of what you need:
- Time clocks (including GPS-verified clock-ins) for actual worked hours and location accuracy.
- Workforce management (WFM) logs for scheduled state, shift changes, and approval history.
- Payroll exports for cost data and overtime differentials.
- POS or production outputs for tying labor hours to actual demand or output volume.
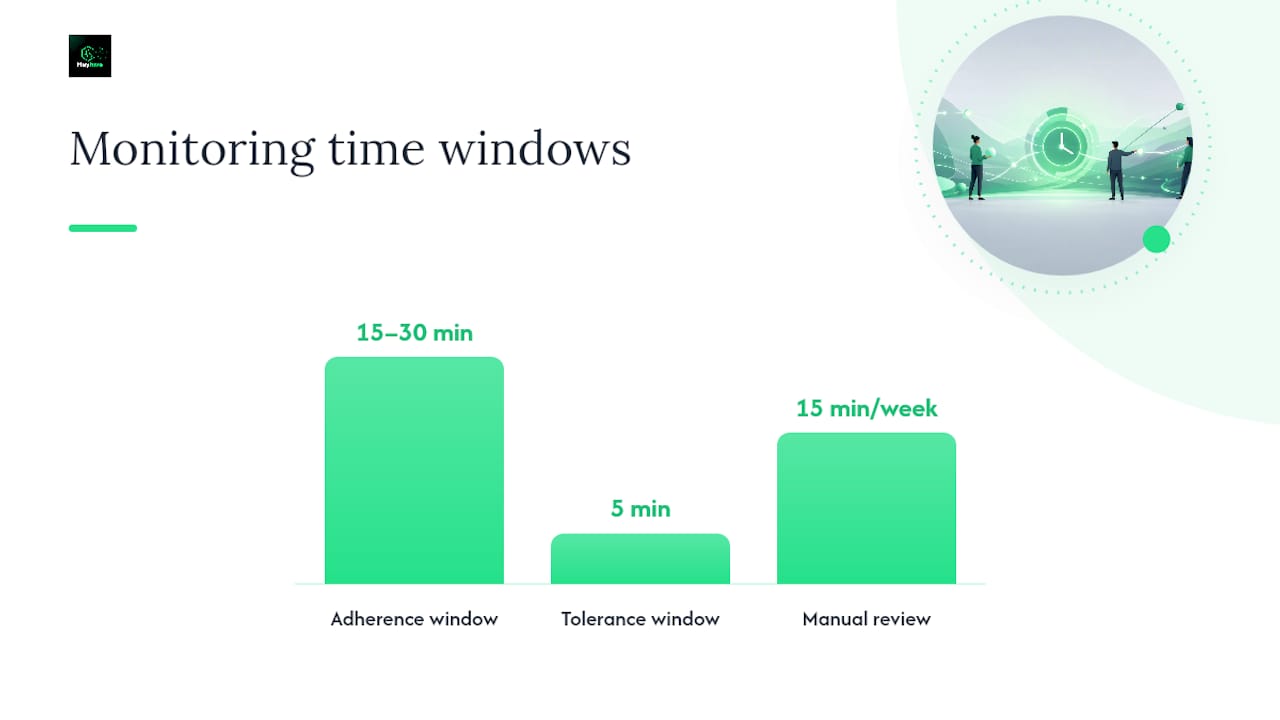
The interval question matters more than most managers realize. Daily totals smooth over the exact moments when coverage actually fails. Measuring adherence in 15 to 30 minute windows shows you precisely when gaps open up, whether that's the lunch rush or the last hour before close, instead of burying that signal in a daily average that looks fine.
Mapping scheduled state to recorded state requires a tolerance window (five minutes is common) so you're not flagging every trivial late clock-in as an adherence failure. Build that tolerance into your dashboard rather than chasing every minor deviation manually.
Pro Tip: Automate the data pull with a scheduled API export or nightly dashboard refresh, but still spend 15 minutes a week manually scanning exception patterns. Automated pulls give you scale; a human eye catches the recurring Tuesday-morning gap that a clean dashboard number won't explain on its own.
For deeper guidance on setting up attendance data sources correctly, this attendance tracking guide walks through timeclock configuration in more detail.
How to Set Realistic KPI Targets
Don't copy another company's benchmarks and call it a target. Every operation has a different shift structure, labor pool, and demand pattern, so the smartest first move is building your own baseline before setting any goal.
- Pull 30 to 90 days of historical data on your chosen KPIs before setting any target.
- Set phased goals: a modest short-term target for month one, a tighter mid-term target for month three.
- Treat published benchmarks (like 90 to 95% adherence) as reference points, not mandates, especially in your first quarter of tracking.
- Combine your core KPIs into a single schedule quality score on one dashboard, with one named owner and a fixed weekly review cadence.
- Pilot any scheduling rule change on one team or location before rolling it out everywhere.
A/B testing a rule change, say, a new overtime cap or a revised notice window, on a single shift or department for two to four weeks tells you far more than guessing based on industry averages ever will.
What to Do When a KPI Signals Trouble
Numbers only matter if they trigger action. Here's the triage sequence for the five most common deviations:
- Adherence drops. Check the interval-level dashboard first, not the daily summary. Identify exactly which time blocks show the gap, redeploy staff from lower-demand intervals, and if the pattern repeats for two weeks straight, coach the specific individuals or adjust the shift structure itself.
- Overtime climbs. Start with forecast accuracy: are you consistently under-scheduling for the same days? Add temporary coverage options before defaulting to overtime, set a hard overtime cap per employee per week, and rebalance shift lengths to reduce the overlap that forces extra hours.
- Open-shift percentage or time-to-fill rises. Review whether availability data is current, expand cross-training so more people can cover more roles, and test a shorter notice window or a small incentive for fast pickups.
- Labor cost as a percent of revenue climbs. Check whether the demand mix or skill mix shifted, not just headcount. Reallocating roles or cutting unnecessary overlapping shifts usually fixes this faster than blanket hour cuts.
- Employee satisfaction signals weaken. A spike in swap requests or shift giveaways is an early warning most managers ignore until turnover hits. Act on the pattern directly with targeted schedule changes for the affected team, not a generic policy memo.
Pro Tip: Track swap and giveaway frequency as its own number, not just a footnote. A sudden jump almost always shows up weeks before a satisfaction survey would catch the same problem.
For a deeper breakdown of overtime-specific corrective tactics, see this guide on preventing overtime scheduling.
A 30-Day KPI Rollout Using an AI Scheduling Platform
Manually instrumenting all eight KPIs from scratch can take weeks. A platform like Heyhive shortens that runway by generating a full week of shifts in seconds, built around each employee's availability, certifications, and overtime limits, while you still approve every schedule before it publishes.
That approval step matters. You get the speed of automation without losing the final say on quality control. In practice, this is what week one looks like:
- Day 1 to 2: Let the AI draft the week's schedule, then approve or adjust it. This alone cuts schedule creation time dramatically compared to a spreadsheet build.
- Day 3: Turn on GPS-verified clock-ins so worked-hours data feeds your adherence calculation accurately from the start.
- Day 4: Set overtime limits in the platform so the cap you decided on in the target-setting stage enforces itself automatically.
- Day 5 onward: Use auto-fill for open shifts to shrink time-to-fill, and export payroll-ready hours to calculate labor cost as a percent of revenue without a manual reconciliation step.
By day 30, you have a real baseline built on accurate data instead of guesswork.
Industry-Specific Variations in Scheduling KPIs
The eight core KPIs apply broadly, but the weight each one carries shifts by industry. In restaurants, labor cost as a percent of revenue often gets tracked daily, sometimes even meal-period by meal-period, because food and labor costs together drive margin so directly. Adherence matters, but it's usually measured in tighter, shorter windows tied to service rushes.
Retail leans harder on schedule fill rate and open-shift percentage, since foot traffic swings by hour and day, and an unfilled shift during a Saturday peak costs more than the same gap on a Tuesday morning. Call centers and customer service teams treat adherence as the headline metric, often layering service-level thresholds directly on top of it, since a five-minute adherence gap can cascade into missed response-time targets.
Field service and contractor operations, where GPS-verified time tracking matters most, tend to prioritize time-to-fill and no-show rate over pure adherence, because a missed dispatch has a harder cost than a slightly late clock-in. Healthcare scheduling adds certification matching as a filter layered on top of every KPI above, since a filled shift with the wrong credential doesn't count as coverage at all.
The lesson across all of them: pick your top three KPIs based on what actually threatens your margin or your service level, not based on a generic list.
How Employee Satisfaction Shapes Your Scheduling Numbers
Every KPI on this list eventually reflects how employees feel about their schedules, whether you're measuring it directly or not. Rising swap requests and shift giveaways are two of the clearest early signals of schedule friction, and tracking those signals alongside satisfaction surveys gives you a warning system that shows up weeks before turnover data does.
The mechanism runs in both directions. Poor adherence and chronic understaffing push satisfaction down, which then drives more swap requests and call-outs, which then makes adherence and fill rate worse. It's a loop, and once it starts, it accelerates. A team stretched thin by overtime doesn't just cost more; the people working those extra hours start calling out more often, which creates the exact coverage gap that caused the overtime in the first place.
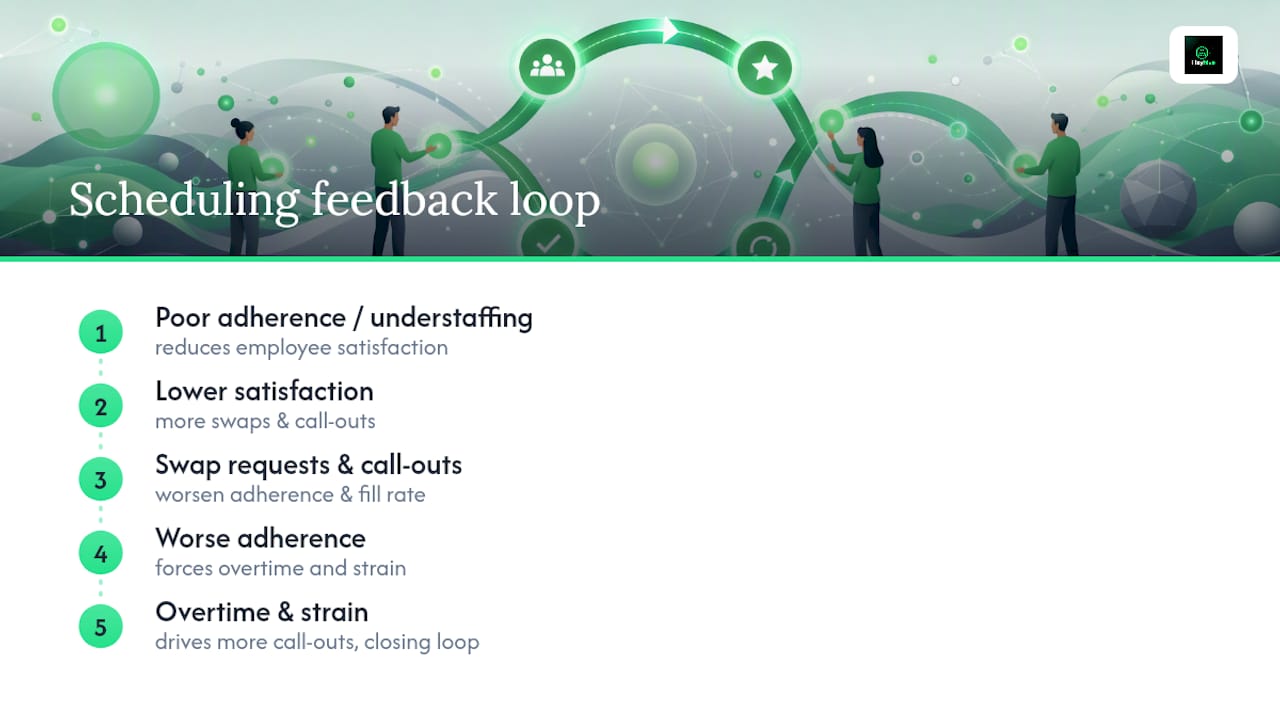
Breaking the loop usually means treating employee-sourced signals as a KPI input, not an HR afterthought. If swap frequency on a specific shift or team jumps, that's data worth acting on with the same urgency as an adherence dip. Managers who fold satisfaction signals into their weekly KPI review, rather than reviewing them separately once a quarter, tend to catch the loop before it shows up in harder numbers like turnover or absenteeism.
Where Predictive Analytics Fits Into Scheduling KPIs
Every KPI covered so far is backward-looking. It tells you what happened last week or last month. Predictive analytics flips that, using historical demand patterns, seasonal trends, and even weather or local event data to forecast staffing needs before you build the schedule at all.
The practical payoff shows up first in overtime rate and open-shift percentage. If your forecast catches a demand spike three days out instead of finding out the morning of, you can adjust the schedule proactively instead of scrambling to fill gaps with overtime or last-minute open shifts. That's a direct line from better forecasting to two of your hardest-to-control KPIs.
Adherence benefits too, though less directly. A schedule built on an accurate demand forecast asks people to work when they're actually needed, which reduces the mismatch between scheduled hours and real workload that often drives adherence problems in the first place. Fewer people get scheduled into slow periods where boredom and clock-watching creep in, and fewer shifts go understaffed during rushes that trigger stress-driven no-shows.
The caveat: predictive tools are only as good as the historical data feeding them. A new location or a business with under a year of consistent scheduling history won't get much lift from forecasting yet. Build your KPI baseline first, then layer prediction on top once you have enough historical pattern to forecast against.
Connecting Scheduling KPIs to Business Performance
Scheduling KPIs don't live in a silo, even though most managers track them that way. Labor cost as a percent of revenue is the most obvious bridge to the finance side of the business, but it's not the only one. Schedule fill rate connects directly to service quality metrics like customer wait times or order accuracy, since an understaffed shift almost always shows up downstream as a slower or worse customer experience.
Overtime rate ties into gross margin the same way raw material costs do, and treating it as a pure scheduling metric instead of a P&L input undersells how much it moves the numbers leadership actually cares about. A schedule creation time that eats ten hours of a manager's week is also an opportunity cost. Those are ten hours not spent on inventory, training, or the customer floor.
The practical move is putting two or three scheduling KPIs on the same dashboard leadership already reviews for revenue and margin, rather than keeping workforce metrics in a separate report nobody outside operations ever opens. When labor cost as a percent of revenue sits next to actual revenue trend lines, a spike explains itself immediately instead of triggering a separate investigation. That single change, folding scheduling data into the existing business review, is often what finally gets scheduling KPIs the attention they deserve from people above the shift-manager level.
Common Pitfalls and a Week-1 Checklist
Five mistakes show up again and again when managers start tracking scheduling KPIs. First, measuring too many metrics at once and drowning in dashboards nobody reviews. Second, using daily adherence averages instead of interval-level data, which hides exactly when gaps happen. Third, copying industry benchmarks without a baseline of your own numbers first. Fourth, ignoring employee-sourced signals like swap requests until turnover already spiked. Fifth, changing three scheduling rules at once so you can never tell which one actually moved the needle.
Here's the week-1 checklist worth running instead of overthinking it:
- Pick three to five KPIs from the core list, not all eight.
- Instrument interval-level adherence tracking immediately.
- Baseline your chosen KPIs for 30 days before setting any target.
- Assign one owner per KPI, even if that owner is you.
- Set a fixed weekly review cadence and put it on the calendar now.
- Pilot exactly one rule change on one team before scaling it.
- Ask employees directly what's driving swap requests or call-outs.
None of this requires new software to start. It requires discipline about measuring the same handful of numbers the same way, every week, before you touch anything else.
— Heyhive
Baseline Your KPIs in Days, Not Quarters
AI-powered scheduling platforms can turn the week-1 checklist above from a manual project into something completed quickly. Such platforms build a full week of shifts around real availability, certifications, and overtime limits automatically, while still allowing schedule approval before publication.
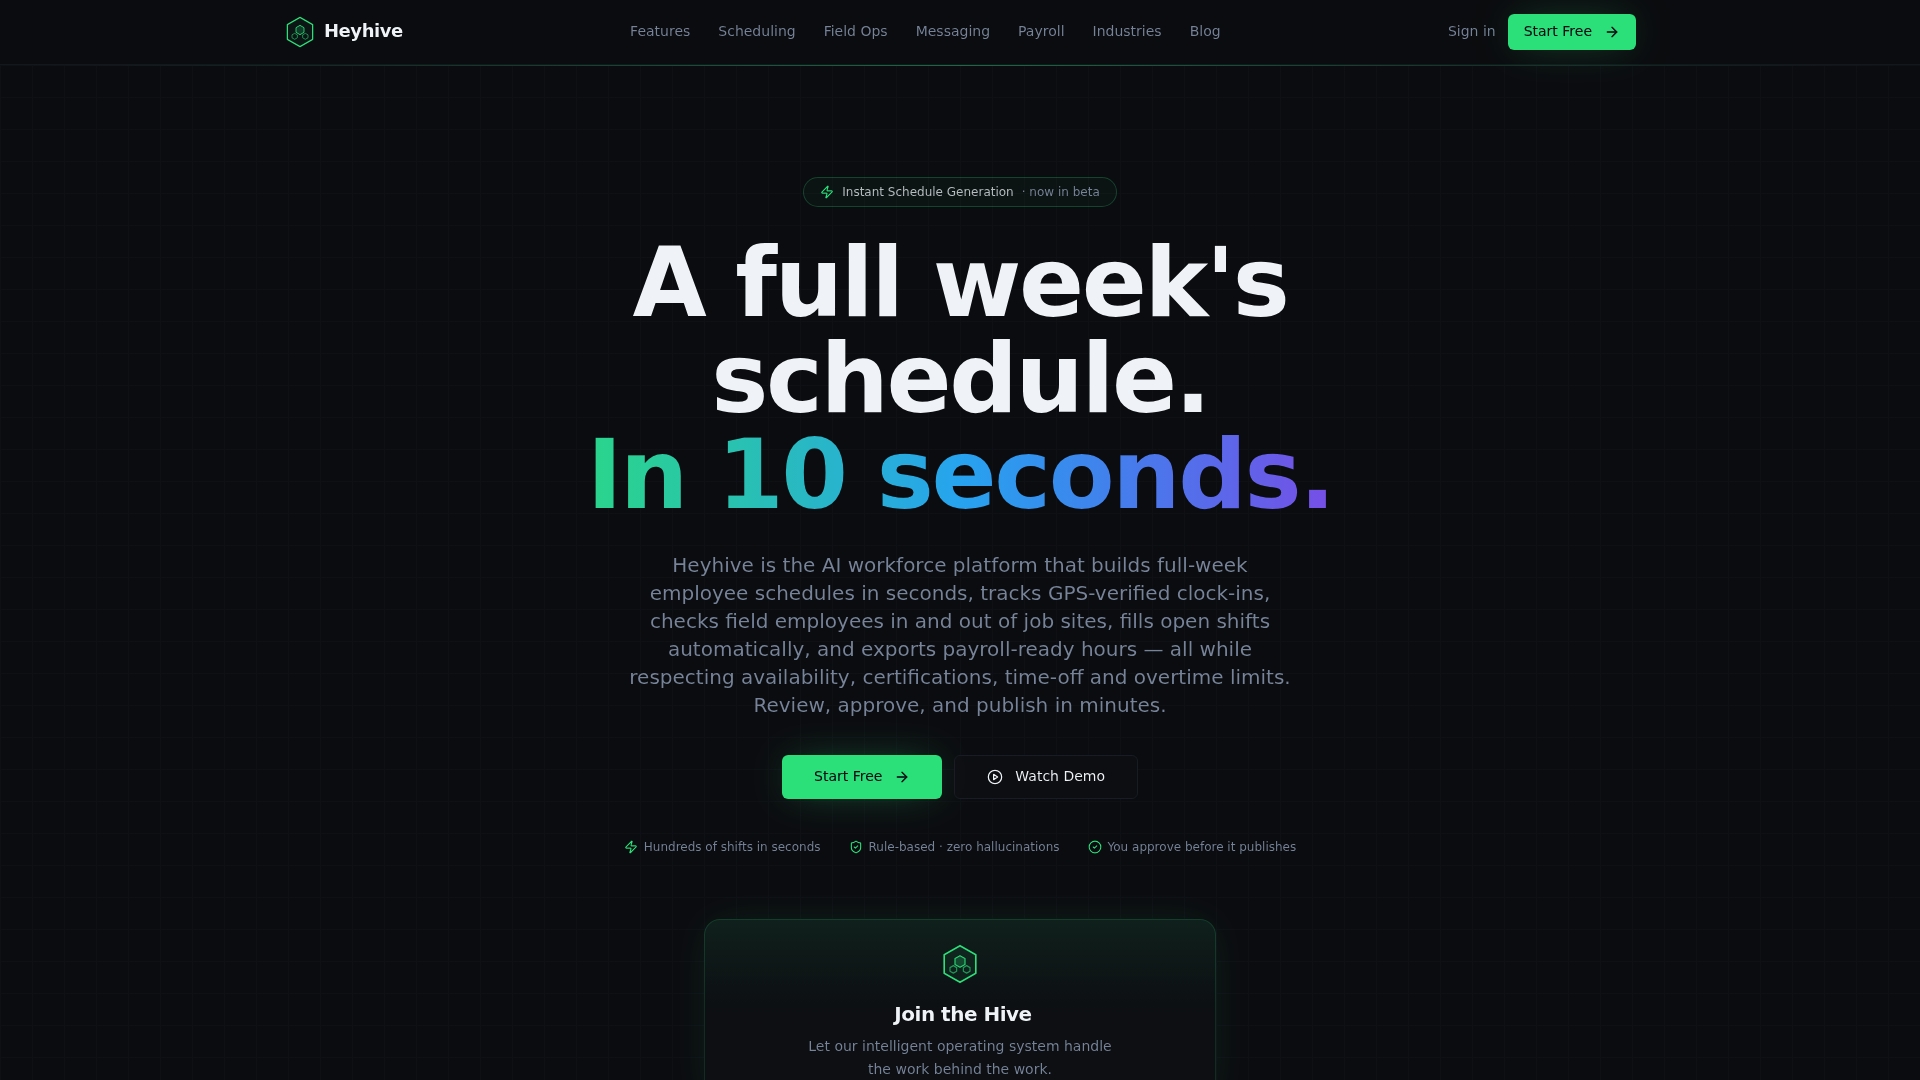
The approval step separates AI scheduling platforms from fully automated black boxes: you get speed without giving up control. GPS-verified clock-ins feed accurate worked-hours data into adherence calculations, overtime limits enforce caps automatically, and payroll-ready exports reduce the need for manual labor cost reconciliations. Open shifts fill faster through auto-fill features, improving time-to-fill without extra calls or texts. If your team is still comparing workforce platforms, this breakdown of top scheduling software is worth a look, and for HR tooling beyond scheduling, this comparison of HR software options covers adjacent tools worth knowing about.
Visit Useheyhive to start a free trial and have your first KPI baseline running within days.
Sources
- What schedule adherence measures and how interval-level tracking helps
- Schedule adherence definition and formula
- AWS Connect schedule adherence guidance and thresholds
- How to calculate the labor efficiency ratio