
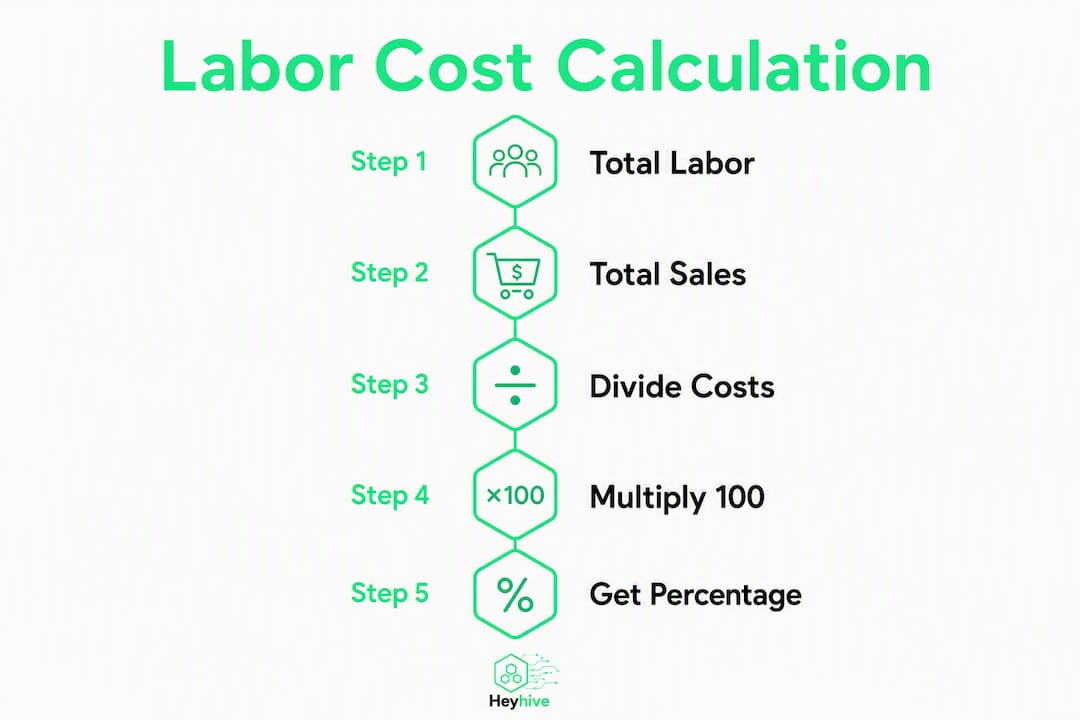
Your labor cost percentage is calculated with one formula: (Total labor cost ÷ Total sales) × 100. Run it against gross sales for the same reporting period — daily, weekly, or monthly — and you have the single most actionable number in your operation.
For restaurants and service businesses, healthy ranges break down by concept: quick-service targets roughly 20–25%, fast-casual 25–30%, casual dining 28–35%, and fine dining up to 30–40%. Most other service businesses fall somewhere in the 20–35% band. If your number sits above your concept's ceiling, the fix starts this week: pull your payroll export, match it to your POS sales total for the same period, and run the calculation before your next schedule goes out.
Table of Contents
- What does "labor cost" actually include?
- How to calculate your labor cost percentage (with a worked example)
- What to include (and what to leave out) when totaling labor cost
- Fixed vs. variable labor costs: why the distinction matters for planning
- What's a normal labor cost percentage? Benchmarks by concept
- Why labor cost percentage matters — and how to read it in context
- How to reduce your labor cost percentage: tactics ranked by speed
- Common calculation mistakes and how to fix each one
- How AI scheduling and GPS-verified time clocks reduce your labor cost percentage
- Key Takeaways
- A manager's perspective: what to test first in 90 days
- Faster labor cost control starts with the right platform
- Sources and further reading
What does "labor cost" actually include?
Labor cost percentage measures what share of every sales dollar goes to paying your team. The formula sounds simple, but the numerator is where most managers go wrong.
"Total labor cost" means every dollar your business spends to put a person to work — not just the paycheck they take home. It includes gross wages, employer payroll taxes, benefits, workers' comp, and paid time off.
Direct labor covers the front-line roles tied directly to production and service: line cooks, servers, baristas, cashiers, delivery drivers. Indirect labor covers the support roles that keep the operation running: managers, trainers, cleaning staff, and back-office coordinators. Both count toward your total.
The most common undercounting mistake is tracking only base wages. When you add employer-side costs — FICA, FUTA, SUTA, workers' comp, health insurance, 401(k) matching, paid leave, and onboarding — your true labor cost runs 15–25% higher than the paycheck line alone. That gap is not trivial on a $50,000 weekly payroll.
How to calculate your labor cost percentage (with a worked example)
The process has four steps. Follow them in order and you will get a number you can actually benchmark and act on.
- Choose your measurement period. Pick one consistent window: a single day, a full week, or a calendar month. Weekly is the practical minimum for most operators; shift-level tracking is best practice for tight-margin businesses.
- Total all labor costs for that period — fully burdened. Add gross wages (hourly and salaried), employer payroll taxes, workers' comp, health benefits, paid time off, bonuses, and any training costs that hit the period.
- Pull gross sales for the exact same period. Use your POS total before discounts, voids, or COGS are subtracted. Gross sales keep your metric comparable to industry benchmarks — net figures do not.
- Apply the formula and round to one decimal place. (Total labor cost ÷ Gross sales) × 100.
Worked example:
| Line item | Amount |
|---|---|
| Total labor cost | $20,972 |
| Labor cost percentage | 29.1% |
That 29.1% sits comfortably inside the fast-casual benchmark band. If the same operation ran $20,972 in labor against only $58,000 in sales, the percentage jumps to 36.2% — a clear signal to investigate scheduling or sales volume.
Period matching is the most important discipline in this calculation. If your payroll runs Tuesday–Monday but your POS week closes Sunday, you will always be comparing different windows. Align both to the same start and end date, or use a rolling seven-day average for volatile businesses.
Pro Tip: Export your payroll summary and POS daily sales report every Monday morning. Drop both into a simple spreadsheet and calculate the prior week's labor percentage before you build the next schedule. That single habit catches problems before they compound.
What to include (and what to leave out) when totaling labor cost
Getting the numerator right is what separates a useful metric from a misleading one.
Standard inclusions: gross hourly and salaried wages, employer share of FICA (Social Security and Medicare), FUTA and SUTA unemployment taxes, workers' compensation premiums, health and dental insurance contributions, 401(k) or retirement matching, accrued paid time off, performance bonuses, and documented training or onboarding costs.
Tips and tip credits require a short note. In tip-credit jurisdictions, servers may be paid a sub-minimum cash wage with tips making up the difference. For labor cost percentage purposes, use the actual cash wage you pay — not the full minimum wage — since tips are not your payroll expense. If you run a tip pool or service charge that flows through payroll, include only the employer-paid portion.
Contractors and 1099 workers are a judgment call with a clear rule: if a contractor performs regular, recurring operational work (a line cook who works every Friday, a cleaning crew on contract), include their cost. If they are a one-time vendor, exclude them. Document your policy and apply it consistently so your percentages stay comparable period over period.
Unpaid breaks and comped labor should not inflate your cost figure. Only count hours and wages you actually pay. When exact benefit costs are unavailable mid-period, apply a ~25% burden on top of base wages as an estimate — label it clearly so you can true it up when the actual figures arrive.
Fixed vs. variable labor costs: why the distinction matters for planning
Not all labor costs move the same way when sales change. Understanding which costs flex and which stay fixed is what makes scheduling decisions defensible.

Fixed labor costs include salaried managers, guaranteed-hour contracts, and benefits that accrue regardless of sales volume. You cannot cut these quickly. A general manager on salary costs the same whether you do $8,000 or $18,000 in a day.
Variable labor costs are hourly wages and overtime tied directly to staffing levels and shift length. These are the costs you can adjust week to week by changing the schedule.
The practical implication: on a slow Tuesday, your fixed labor is already committed. The only lever you have is variable labor — sending a server home early, cutting a prep shift, or consolidating stations. On a holiday weekend, variable labor can spike fast if you have not built overtime controls into your approval workflow.
For cash flow planning, separate your fixed labor floor from your variable labor budget. The fixed floor is a sunk cost in the short term; the variable budget is where scheduling decisions actually move the needle. When you forecast the next four weeks, build the schedule against projected covers or sales, not last week's headcount.
What's a normal labor cost percentage? Benchmarks by concept
Benchmarks only help when you compare against the right peer group. A 35% labor rate is fine for a full-service dinner house and a warning sign for a quick-service counter.
| Concept type | Typical labor cost % range |
|---|---|
| Quick-service / fast food | 20–25% |
| Fast-casual | 25–30% |
| Casual dining | 28–35% |
| Full-service / fine dining | 30–40% |
| Coffee shop / café | 30–40% |
| Retail (general) | 15–30% |
| Service businesses (general) | 20–35% |
These ranges reflect concept-specific benchmarks shaped by service model, menu complexity, average check size, and regional wage levels. A café with high touch-time per customer and lower average checks will always run higher than a fast-food counter with a streamlined production line.
For restaurants specifically, labor percentage is best read alongside food cost as part of prime cost (labor + COGS combined). Most operators target a prime cost below 60–65% of gross sales, leaving enough margin to cover overhead and generate profit. If your labor is at 32% and food cost is at 34%, your prime cost is 66% — tight, but manageable. If both are elevated simultaneously, the math stops working fast.
A few factors that push labor percentages higher than the benchmark band:
- High minimum wage markets (California, New York, Washington)
- Tip-included or service-charge models that shift wage costs onto the employer
- Complex menus requiring more skilled, higher-paid kitchen labor
- High turnover driving up training and onboarding costs
Why labor cost percentage matters — and how to read it in context
Labor percentage tells you how much of each sales dollar goes to paying your team. On its own, that is useful. Read alongside COGS and overhead, it becomes the basis for every profitability decision you make.
Two valid formulas exist: labor as a percentage of total sales, and labor as a percentage of total operating costs. This guide uses the sales-based version because it aligns with industry benchmarks and makes period-over-period comparisons clean.
The dollar impact of a percentage shift is direct. On $1 million in annual revenue, a 5-point reduction in labor cost percentage saves $50,000. On $3 million, the same 5-point move is $150,000. That is real margin — not a rounding error.
But cutting labor to hit a percentage target without watching the other variables is a trap. Reduce staff too aggressively and service quality drops, table turns slow, and sales follow. The right approach is to track labor percentage alongside:
- Covers per labor hour — for table-service restaurants
That last metric is often the fastest diagnostic. A sustained positive variance between scheduled and actual labor almost always points to unmanaged overtime, late punches, or a staffing plan that does not match real demand.
How to reduce your labor cost percentage: tactics ranked by speed
Start with the fastest wins. Structural changes take months; scheduling discipline can move your number this week.
Fast wins (this week):
- Fix your reporting period alignment. If payroll and sales periods do not match, every calculation is wrong. Align them now.
- Enforce clock-in/out discipline. Early clock-ins and late clock-outs add unplanned labor minutes that compound across a full team. Set a five-minute window and enforce it.
- Cut overtime before it starts. Review the schedule mid-week. If anyone is approaching 40 hours by Thursday, reassign or reduce Friday hours before the OT clock starts.
- Send staff home when covers drop. Build a written policy: if sales fall below a set threshold by a specific time, one or two variable-cost positions go home. Managers should not need to improvise this decision every shift.
Medium-term improvements (this month):
- Build shift templates from your best-performing weeks. Identify the weeks where labor percentage hit your target and sales were strong. Use those schedules as templates for similar forecast periods.
- Cross-train for coverage flexibility. A server who can also run food or a prep cook who can handle cold station reduces your minimum staffing floor without hurting service.
- Align staffing to forecasted covers, not habit. If Tuesday lunch historically runs 40% of Friday dinner volume, the schedule should reflect that — not mirror Friday's headcount.
Structural changes (this quarter):
- Simplify the menu during slow periods. Fewer SKUs during off-peak hours means fewer prep positions and faster ticket times.
- Redesign station layout for throughput. Reducing steps between stations cuts labor minutes per cover without reducing headcount.
- Review your staffing model against your service promise. If you are running full-service labor costs on a fast-casual concept, the model is misaligned — not just the schedule.
Pro Tip: Set a weekly labor percentage target before the schedule goes out, not after the week closes. Build the schedule to hit the target, then track actual vs. scheduled variance daily. Reacting to last week's number is always slower than building this week's schedule to a budget.
Common calculation mistakes and how to fix each one
Most labor percentage errors fall into a short list of repeatable mistakes.
Mismatched payroll and sales periods is the most common. Fix: pick one reporting week (Sunday–Saturday works for most operations) and pull both payroll and POS data for that exact window every time.
Excluding payroll taxes and benefits understates true labor by about 20%. Fix: use fully burdened labor costs. If you do not have exact benefit figures mid-period, apply a 20% burden estimate on base wages and true it up monthly.
Mishandling tips distorts the metric in tip-credit states. Fix: use the actual cash wage paid, not the full minimum wage, and exclude customer-funded tips from your labor cost line.
Ignoring contractor costs for regular operational roles creates a false low. Fix: include any contractor who performs recurring operational work and document the policy so it is applied consistently.
Late punch rounding adds phantom labor hours. Fix: set a strict clock-in window in your time-tracking system and review exceptions weekly rather than letting them accumulate.
Beyond individual errors, tracking variance between scheduled and actual labor often tells a clearer story than the absolute percentage. If your scheduled labor was 27% but actual came in at 31%, the four-point gap is the problem to investigate — not just the 31% in isolation.
Data hygiene matters too. Reconcile your payroll export against your time clock records at least weekly. A POS integration that feeds directly into your labor tracking eliminates most manual entry errors before they reach the calculation.
How AI scheduling and GPS-verified time clocks reduce your labor cost percentage
The calculation is straightforward. The hard part is executing it accurately, week after week, across a team that changes shifts, calls out, and clocks in late. That is where AI scheduling and GPS-verified time tracking close the gap between your planned labor percentage and your actual one.
Concrete benefits managers see:
- Faster schedule creation. AI generates a full week of shifts in seconds, respecting availability, certifications, and overtime limits — so you spend time reviewing, not building from scratch.
- Fewer overtime exceptions. The system flags approaching overtime thresholds before the schedule publishes, not after the week closes.
- Accurate timecards. GPS-verified clock-ins confirm that staff are on-site when they punch in, eliminating buddy punching and early clock-ins that inflate labor hours.
- Cleaner variance reporting. Scheduled vs. actual labor is visible in real time, so you can act mid-shift rather than react to last week's payroll.
- Payroll-ready exports. Hours feed directly into your payroll process without manual re-entry, reducing errors that create reconciliation problems downstream.
The manager approval workflow is what keeps AI scheduling trustworthy. Heyhive generates the schedule; you review and approve it before it publishes. You can override any shift, adjust coverage levels, and set rules for overtime approval. The AI handles the calculation work; you retain control of the decision.
Pro Tip: Monitor three numbers in your scheduling platform every shift: running labor percentage vs. target, SPLH vs. forecast, and scheduled-to-actual variance. If all three are within range, the shift is on track. If one breaks, you know exactly where to look.

Key Takeaways
Accurate labor cost percentage requires fully burdened costs, period-matched sales, and weekly variance tracking — not just a paycheck total divided by revenue.
| Point | Details |
|---|---|
| Use the correct formula | (Total labor cost ÷ Gross sales) × 100, with both figures from the same reporting period. |
| Include fully burdened costs | Add payroll taxes, benefits, and workers' comp — omitting them understates true labor significantly. |
| Match your concept benchmark | Quick-service targets 20–25%; casual dining 28–35%; fine dining up to 40%. |
| Track scheduled vs. actual variance | A sustained gap between planned and actual labor signals overtime or scheduling discipline problems. |
| Use Heyhive to close the gap | AI scheduling, GPS-verified clock-ins, and real-time variance alerts help you hit your labor target before the week closes. |
A manager's perspective: what to test first in 90 days
Test forecasting and schedule-to-sales matching first. It delivers the fastest, most measurable improvement — and it costs nothing to start.
30 days: Fix the foundation. Align your payroll and sales reporting periods. Enforce clock-in/out discipline with a defined window. Pull a fully burdened labor cost for each of the past four weeks and calculate your actual percentage. You cannot manage what you have not measured accurately. Your KPI target here: zero mismatched reporting periods, and a baseline labor percentage you trust.
60 days: Build the system. Create shift templates from your three best-performing weeks. Start scheduling to a labor percentage budget rather than a headcount number. Begin cross-training at least two team members for flexible coverage roles. Track SPLH weekly alongside labor percentage. Target: scheduled vs. actual variance below two percentage points.
90 days: Make structural changes. Review your menu for slow-period simplification opportunities. Assess whether your staffing model matches your service concept. If overtime is still running above target, redesign the approval workflow so no shift can go live with projected OT without manager sign-off. Target: labor percentage within your concept benchmark band for at least three consecutive weeks.
One change management note: tell your team what you are measuring and why. Managers who explain the labor percentage target to shift leads get faster buy-in on clock discipline and early send-home policies than those who enforce rules without context. Transparency about the number makes the operational changes feel like shared goals rather than arbitrary cuts.
Faster labor cost control starts with the right platform
Manual scheduling and spreadsheet-based labor tracking leave money on the table every week. Heyhive gives you the tools to close that gap without adding administrative hours.
With Heyhive, you get AI-generated schedules built to your labor budget, GPS-verified clock-ins that eliminate timecard errors, and real-time variance alerts so you know mid-shift whether you are on track. Payroll-ready hour exports mean your labor cost calculation takes minutes, not a morning.
- AI schedule generation respects availability, certifications, and overtime limits automatically
- GPS-verified attendance confirms on-site clock-ins for field and multi-location teams
- Variance alerts flag scheduled vs. actual gaps before they become payroll surprises
- Payroll-ready exports feed directly into your payroll process with no manual re-entry
In your first 30 days, measure scheduled vs. actual variance weekly and track whether your labor percentage moves toward your concept benchmark. Most managers see the gap narrow within the first two to three scheduling cycles.
Start your free trial at Heyhive and build your first AI-generated schedule today.
Sources and further reading
The table below lists the most useful external calculators, benchmark references, and Heyhive resources for going deeper on labor cost analysis and scheduling implementation.
| Resource | What it offers |
|---|---|
| Labor Cost Calculator — Coefficient | Free online calculator with input fields for wages, taxes, and benefits; includes period-matching guidance and sensitivity checks. |
| Labor Cost Percentage Calculator — RestaurantCalcs | Restaurant-specific calculator with concept benchmark bands and fully burdened cost guidance. |
| Labor Cost Formula and Examples — OnPay | Clear formula walkthrough with payroll context and service-industry examples. |
| Labor Cost — Oyster HR Glossary | Explains both sales-based and operating-cost-based formulas and when each applies. |
| Omni Calculator — Labor Cost | Quick sensitivity calculator for checking labor percentage across different wage and benefit scenarios. |
| Restaurant Labor Cost — RAMW | Restaurant Association guidance on calculating and reducing labor cost percentage for operators. |
| BLS Employer Costs for Employee Compensation | Bureau of Labor Statistics data on employer-side compensation costs by industry. |
| AI Employee Scheduling — Heyhive | How AI schedule generation and manager approval workflows reduce labor waste. |
| GPS Time Clock Software — Heyhive | GPS-verified clock-in benefits for attendance accuracy and payroll readiness. |
| Employee Attendance Tracking Guide — Heyhive | Practical attendance tracking guidance for hourly and field teams. |