
Schedule adherence tracking measures how closely an agent's real-time activity matches what the schedule says they should be doing, minute by minute. The single most important first move for any supervisor reading this: turn on interval-level real-time adherence monitoring and set sensible buffer thresholds before you touch anything else. Everything downstream, from service-level protection to fair coaching conversations, depends on getting that foundation right.
Most contact centers already collect the raw data needed for this. The gap is usually in how it's displayed and acted on. A daily adherence percentage that looks fine can hide a brutal 15-minute stretch where four agents were simultaneously on an unscheduled break during your afternoon call spike. Real-time tracking, watched at the interval level, catches that before it wrecks your service level.
Before you configure anything, check these three things first:
- Dashboards — confirm you have a live view (not just end-of-day reports) showing agent status against scheduled activity.
- Thresholds — verify buffer windows exist for start/stop times and break durations, not a rigid zero-tolerance setting.
- Permissions — know who can view, edit, and override adherence settings, since audit trails matter later.
Pro Tip: Set your first threshold pass loose, not tight. A generous buffer window that catches real problems builds trust in the data; a punitive one just teaches agents to game the system.
Key Takeaways
Schedule adherence tracking works best when measured at the interval level with fair buffer thresholds, monitored in real time, and used to improve schedules rather than punish agents.
| Point | Details |
|---|---|
| Measure by interval | Track adherence in 15 or 30 minute windows, not just daily averages, to catch peak-hour deviations. |
| Set buffer thresholds | Use start/stop buffers of a few minutes so normal transitions don't trigger false non-adherence. |
| Prioritize real-time monitoring | Live dashboards allow intraday recovery before service levels take a hit. |
| Balance accountability with wellbeing | Targets above 97% often signal overly rigid thresholds that increase burnout risk. |
| Use Heyhive for the full loop | Heyhive pairs AI-generated schedules with real-time attendance and GPS-verified clock-ins to close the gap between planning and tracking. |
Table of Contents
- What Does Schedule Adherence Actually Measure?
- What Adherence Metrics Should Supervisors Track?
- Where Do You Actually View Adherence Data?
- How Should You Configure Adherence Thresholds and Alerts?
- How Do You Monitor and Respond During a Live Shift?
- What Best Practices Improve Adherence Without Burning Out Agents?
- What Causes Non-Adherence and How Do You Fix It?
- What Does a Rollout Checklist Look Like?
- What Pitfalls Should You Watch For?
- How Do You Set This Up With Heyhive?
- Adherence as Signal, Not Sentence
- Get Real-Time Schedule Adherence Tracking With Heyhive
- Sources
What Does Schedule Adherence Actually Measure?
Schedule adherence is the percentage of an agent's scheduled time spent in the planned activity state at the planned moment. The standard formula, as Dial's WFM glossary lays out, is straightforward: Adherence = (Time in Scheduled State ÷ Total Scheduled Time) × 100.
Three components drive that number. Scheduled time is the total block an agent is supposed to work a given activity. Adherent time is the portion they actually spent doing what the schedule called for. Non-adherent time is everything else, whether that's a late login, an extended break, or an unscheduled bathroom trip during a queue spike. Get any of these wrong and the resulting percentage misleads you.
Here's the part most supervisors miss: adherence is fundamentally an interval-level metric, not a daily one. WFM Labs draws a sharp distinction between adherence, which checks moment-by-moment matching between scheduled and actual state, and conformance, which just totals up realized time regardless of when it happened. That's why mature centers report adherence in 15- or 30-minute buckets rather than a single daily rollup.
The operational payoff is direct. Tight interval-level adherence keeps your staffing model honest. When agents are where the schedule says they should be, occupancy calculations hold up, service-level targets stay achievable, and customers spend less time in queue. Slippage compounds fast: a handful of agents drifting out of adherence during peak hours can push wait times up noticeably even when your total staffed hours for the day look correct on paper.
| Metric | What It Measures |
|---|---|
| Scheduled time | Total planned minutes for an activity or shift block |
| Adherent time | Minutes actually spent matching the scheduled activity |
| Non-adherent time | Minutes spent outside the scheduled activity |
| Adherence percentage | Adherent time divided by scheduled time, expressed as a percent |
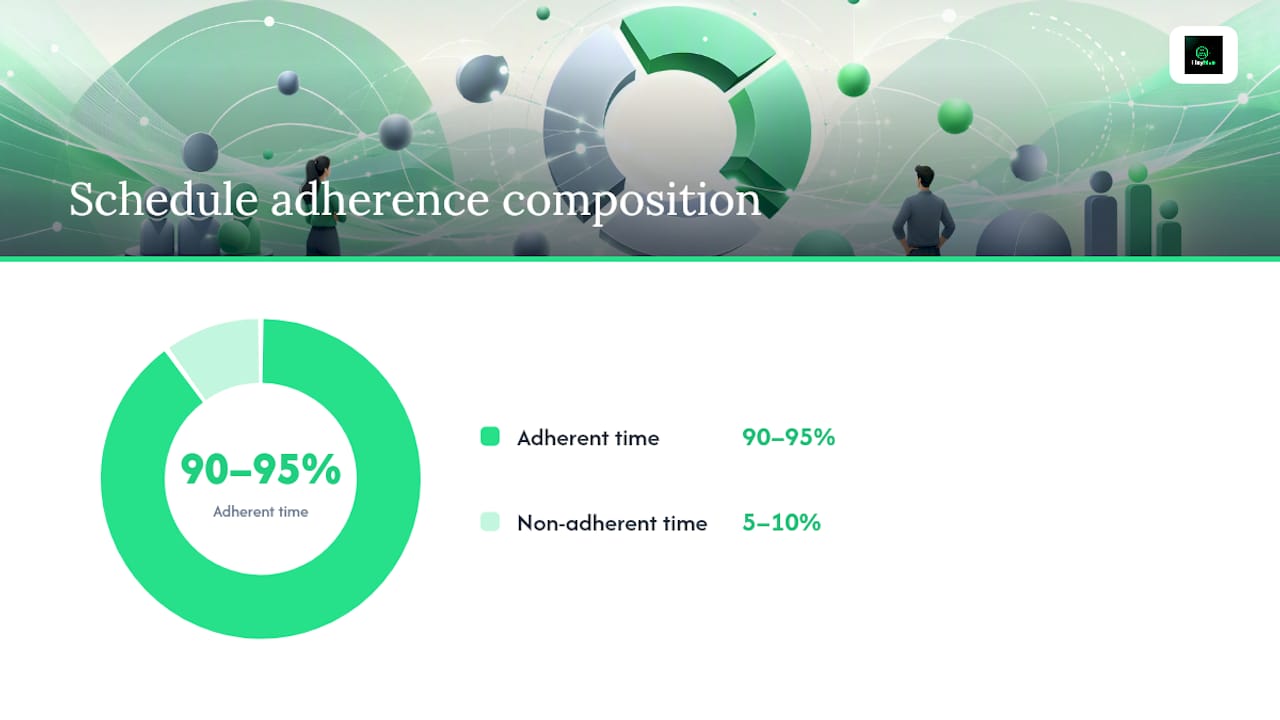
Industry benchmark: Adherence targets commonly cluster in the 90 to 95 percent range, with a caution worth repeating: pushing targets above 97% tends to backfire. It signals overly rigid thresholds that punish normal human transitions (a bathroom break running 90 seconds long) rather than catching genuine coverage risk. Treat a target near 99% as a red flag for your threshold design, not a badge of operational excellence.
What Adherence Metrics Should Supervisors Track?
Four core numbers form the backbone of any adherence report, and each answers a different question about your floor.
Adherence percentage tells you the headline story: how well an agent or team matched the plan over a given window. Adherent time and non-adherent time are the raw minutes behind that percentage, useful when you need to see actual duration rather than a ratio. Scheduled time is your baseline, the denominator everything else compares against. Report these at both the individual and team level, and at both real-time and daily/weekly granularity.
Beyond the core four, a handful of supporting metrics round out the picture:
- Time-in-state shows how long an agent has been in their current activity, useful for spotting a break that's run long before it becomes a full incident.
- Out-of-adherence segments count how many separate non-adherent episodes occurred, which distinguishes one long lapse from five short ones (a pattern that often points to a different root cause).
- Threshold-use percentage tracks how often agents are consuming their buffer window versus staying comfortably inside it, an early signal that your thresholds may need adjusting.
- Head count by activity shows how many agents are currently in each state (available, on break, in a meeting) against how many the schedule calls for.
| Metric | Meaning | Supervisor Action |
|---|---|---|
| Adherent time | Staffed minutes matching plan | Use for intraday recovery decisions |
| Non-adherent time | Minutes of deviation | Investigate patterns, not one-offs |
| Out-of-adherence segments | Frequency of lapses | Flag repeat offenders for coaching |
| Threshold-use percentage | How often buffers get used | Tighten or loosen thresholds accordingly |
Real-time metrics (current status, live adherence percentage, time-in-state) belong on your intraday dashboard. Historical metrics (weekly adherence trends, segment counts over a month) belong in scheduled reports you review for coaching and shift design, not live monitoring. Amazon Connect's documentation on this defines standardized metric identifiers like AGENT_SCHEDULE_ADHERENCE, AGENT_ADHERENT_TIME, and AGENT_NON_ADHERENT_TIME for exactly this reason: consistent naming across real-time and historical views keeps your reporting comparable over time. If you're evaluating any workforce management platform, ask whether it exposes similarly explicit metric identifiers in its API documentation. Vague labels like "adherence score" without a defined calculation method are a warning sign.
Where Do You Actually View Adherence Data?
Three distinct views cover the full lifecycle of adherence monitoring, and confusing them is a common rookie mistake.
The real-time adherence tracker is your moment-to-moment command center. Microsoft's WFM documentation describes this as combining a service rep list, an adherence Gantt chart, and summary metrics in one screen, filterable by time zone and shift plan. The Gantt view is particularly useful because it shows scheduled versus actual activity as parallel timeline bars, so a deviation is visually obvious rather than buried in a percentage.
Historical reports live in a different rhythm. These are for trend analysis, not intraday firefighting: which shifts consistently run low on adherence, which agents show a pattern versus a one-off, and whether last month's schedule redesign actually moved the needle. Pull these weekly or after any significant schedule change.
Calendar and summary views sit between the two, giving you a day-by-day or week-by-week rollup useful for spotting slow-building trends before they show up as a service-level crisis.
Match the view to the task:
- Recovering coverage right now → real-time tracker, Gantt view, filtered to the affected queue.
- Coaching an individual agent → historical report filtered to that agent, showing segment counts over two to four weeks.
- Redesigning a shift pattern → calendar/trend view across a full scheduling cycle, cross-referenced with call volume data.
Genesys documentation recommends a refresh cadence around 20 seconds for real-time adherence displays, fast enough to catch a developing problem without generating so much flicker that supervisors tune it out.
Pro Tip: Save filtered views for your most-watched queues and shift plans. Rebuilding the same filter every shift wastes minutes you don't have during a coverage crunch, and a saved view means you're one click from the data instead of five.
How Should You Configure Adherence Thresholds and Alerts?
Thresholds are what separate a useful adherence metric from a punitive one, and getting them wrong in either direction causes real damage. Too loose, and you miss genuine coverage gaps. Too tight, and you're penalizing agents for a 90-second bathroom break that has zero operational impact.
Amazon Connect's threshold documentation breaks configuration into a few core levers. Start early/late buffers define how many minutes an agent can log in before or after their scheduled start without triggering non-adherence. Allowable variance applies similar logic to activity transitions throughout the shift, like moving from available to break. Strict versus threshold view determines whether your reporting shows raw deviation or only deviation that exceeds your configured buffer.
There's no universal correct buffer size. Think in operational ranges rather than fixed rules: a 3 to 5 minute start buffer works for many phone-heavy environments, while a chat or email queue with more flexible response windows might tolerate more. Set the number, watch it for two to three weeks, and adjust based on how often agents are hitting the edge of it.
Alert wiring matters as much as the threshold value itself. Configure alerts on trailing windows (three consecutive interval breaches, not one) rather than instant triggers, since single-interval noise is common and rarely means anything. Set group-level triggers for team-wide adherence drops, separate from individual-agent alerts, so a systemic issue (a queue overwhelmed by call volume) doesn't get treated the same as one person's isolated lapse.
Before you finalize a threshold policy, run through this checklist:
- Confirm who has permission to change threshold values and whether changes require secondary approval.
- Set an audit log requirement so every threshold change is timestamped and attributed.
- Define separate thresholds per activity type rather than one blanket setting for the whole shift.
- Test the threshold against a week of historical data before rolling it out live.
How Do You Monitor and Respond During a Live Shift?
Real-time monitoring is only valuable if it triggers action fast enough to matter. Microsoft's guidance on proactive adherence monitoring makes the case plainly: catching a deviation while it's happening lets you recover service levels before they show up in end-of-day numbers. Waiting for a retrospective report means the damage is already done.
Start each shift by scanning three headline signals: overall team adherence percentage, the raw count of agents currently out of adherence, and any interval that's already breached its threshold. These three numbers tell you in about ten seconds whether you're having a normal shift or a developing problem.

When a deviation shows up, the response depends on severity. A single agent running two minutes late from break is informational, not urgent. Three agents simultaneously out of adherence during a call spike is a different category entirely, and calls for immediate reassignment of queues or pulling in backup coverage.
Prioritize your interventions by severity:
- Urgent — multiple agents out of adherence during a known peak interval; reassign queues or activate backup staff immediately.
- Moderate — a single agent repeatedly drifting; flag for a same-day coaching conversation, not a formal write-up.
- Informational — isolated, minor deviations within threshold tolerance; log for pattern review, no immediate action needed.
For genuine coverage gaps, your toolkit includes reassigning agents across queues, shifting a scheduled break to a lower-volume interval, or triggering an automated shift-swap request if your platform supports it. Document agent-level incidents as they happen rather than reconstructing them from memory at the end of the week. A quick note tied to the specific interval and reason (not just "was late") makes coaching conversations far more productive.
Pro Tip: Route routine adherence alerts to automated notifications instead of manually scanning the dashboard every few minutes. That frees your attention for the coaching conversations and recovery decisions that actually need a human.
What Best Practices Improve Adherence Without Burning Out Agents?
The best adherence programs treat the metric as a coaching tool, not a disciplinary weapon, and the data backs this approach. Tolerance windows exist precisely because rigid, zero-buffer targets create an adversarial dynamic where agents start gaming the clock instead of genuinely improving their reliability.
Schedule design does more heavy lifting than most supervisors expect. Align break placement to your actual call volume curves rather than defaulting to even spacing throughout the shift. If your data shows a predictable lull at 2 PM, that's your break window, not 11 AM when volume is climbing. Where your platform supports it, let agents have input on shift preferences within defined limits. Self-scheduling options tend to reduce avoidable non-adherence because agents aren't fighting a schedule that never fit their actual life in the first place.
Coach with interval-level detail, not aggregate percentages. Showing them the three specific 15-minute intervals where they drifted, and asking what happened, turns a vague number into an actionable conversation.
- Pair every adherence report with context: was it a system outage, a personal circumstance, or a pattern?
- Use real-time alerts for coverage protection and post-shift review for coaching, not the same mechanism for both.
- Revisit threshold settings quarterly against actual usage data instead of leaving them static for years.
Pro Tip: Pilot any threshold or schedule change with one team for two weeks before rolling it out center-wide. Measure the adherence impact, ask the pilot team what worked, and iterate. A change that looks good on paper can still misfire against real shift patterns.
What Causes Non-Adherence and How Do You Fix It?
Non-adherence rarely comes from a single cause, and the fix depends on which pattern you're actually seeing. A poorly designed schedule that ignores real call volume patterns will generate chronic non-adherence that no amount of coaching fixes, because the problem is the schedule, not the agent. The remedy is redesigning shift and break placement around actual demand data, not tightening enforcement.

Unclear activity-state definitions cause a different kind of trouble. If "available" and "after-call work" aren't clearly distinguished in your system, agents get flagged as non-adherent for doing exactly what they're supposed to do. Fix the activity mapping before you touch the agent's behavior.
Genuine agent-driven lapses, extended breaks, late logins, unauthorized queue switching, do happen, and coaching backed by interval-level data resolves most of them within a few weeks. Chronic cases that persist after documented coaching are a performance management issue, separate from the adherence metric itself.
What Does a Rollout Checklist Look Like?
Before go-live, confirm your technical foundation is solid: schedule version control so you know which schedule was live at any given moment, clear activity-state mapping so every status in your telephony or desktop system maps to a defined schedule activity, and role-based permissions so threshold changes are traceable.
Run a pilot before a full rollout. Pick one or two teams, use 15-minute interval granularity, and measure for at least two full scheduling cycles before drawing conclusions. A single week of data is too noisy to act on.
On the cost side, budget for the data connections that feed adherence calculations (telephony integration, desktop activity sensors) as the primary driver, since the software license itself is usually the smaller line item. Genesys documentation also flags exporting adherence data for downstream reporting as a configuration step worth planning for early, not bolting on later.
| Rollout Step | Owner | Success Criteria |
|---|---|---|
| Activity-state mapping | WFM lead | Every telephony/desktop state maps to one schedule activity |
| Threshold configuration | Supervisor + WFM lead | Thresholds tested against two weeks of historical data |
| Pilot monitoring | Team supervisor | Two full scheduling cycles completed, feedback logged |
| Full rollout & training | WFM lead | All supervisors trained on dashboard and alert response |
- Assign a single owner for threshold governance so settings don't drift team by team without oversight.
- Build a short training session around the real-time dashboard before go-live, not after agents start asking questions.
What Pitfalls Should You Watch For?
The most common mistake is confusing adherence with conformance, treating a healthy daily total as proof that intraday coverage was solid. WFM Labs draws this line clearly for a reason: an agent can hit strong daily numbers while missing the exact 15-minute window your service level depended on. The remedy is straightforward. Report and coach at the interval level, and treat daily aggregates as a supplementary view, not the primary one.
Over-tight thresholds are the second recurring trap, usually born from good intentions ("let's hold everyone accountable") that produce a metric so punitive it stops reflecting reality. If your team's adherence numbers look uniformly poor across the board, check your threshold settings before you assume a widespread performance problem.
Ignoring schedule-quality issues is the third. No amount of monitoring or coaching fixes a schedule that was wrong from the start.
On the governance side, role-based access matters more than most supervisors initially budget for. Not every manager needs permission to alter thresholds, and every change should generate an audit log entry. This becomes especially relevant given how schedule changes ripple backward: Amazon Connect's documentation notes that adjusting a schedule can trigger recalculation of historical adherence figures for up to 30 days after the change, so a mid-cycle schedule edit can quietly shift last month's reported numbers if you're not tracking why.
Pro Tip: Keep a running change log every time you touch a threshold, activity mapping, or schedule template. When an adherence number looks unexpectedly different six weeks from now, that log is the fastest way to find out why.
How Do You Set This Up With Heyhive?
Heyhive maps directly onto the rollout checklist above, which makes the transition from theory to practice fairly short. Heyhive's platform generates AI-built schedules in seconds while respecting agent availability and overtime limits, giving you a clean, accurate baseline for adherence calculations from day one instead of a schedule riddled with manual errors.
- Real-time attendance tracking gives you the live status feed that adherence percentages depend on.
- GPS-verified clock-ins confirm actual arrival and departure for field and multi-site teams, closing a gap that manual sign-in sheets always leave open.
- Manager approval on AI-generated shifts means every schedule your adherence metric gets measured against was reviewed by a human before publication, not auto-published blind.
- Filtered views by team and shift support the same recover-now, coach-later, redesign-later workflow covered in the "where to view" section above.
A practical daily routine: open your real-time attendance view at shift start, scan for any agents already trending toward non-adherence, and address coverage gaps before your first peak interval hits. Save filtered views for your most volume-sensitive queues so you're not rebuilding filters mid-crisis.
Pro Tip: Feed adherence patterns back into your next scheduling cycle. If a specific break placement consistently produces non-adherence, that's a signal for Heyhive's AI scheduling engine to adjust next week's shifts, closing the loop between measurement and schedule design instead of treating them as separate tasks.
Adherence as Signal, Not Sentence
Treat schedule adherence as a diagnostic instrument, not a scorecard for punishment. The number exists to tell you where your schedule design, your staffing assumptions, or an individual agent's habits are drifting from plan. Read it that way, and it becomes one of the most useful pieces of data a supervisor has. Read it as a stick for enforcement, and it corrodes trust while teaching agents to optimize for the metric instead of the outcome it's supposed to represent.
Three implications follow from that stance:
- Schedule iteration: every adherence pattern is feedback for your next scheduling cycle, not just a record of last week's compliance.
- Human-centered enforcement: pair every threshold breach with context before deciding it's a coaching issue, not an automatic escalation.
- Variance harvesting: recurring, low-severity deviations across many agents usually point to a schedule design flaw, not a workforce discipline problem.
Get Real-Time Schedule Adherence Tracking With Heyhive
Heyhive gives you the interval-level attendance data and AI-built schedules this whole approach depends on, without the manual reconciliation work that eats a supervisor's morning. Real-time attendance tracking shows you exactly who's in adherence right now, GPS-verified clock-ins confirm field and multi-site arrivals without guesswork, and AI-generated schedules built around actual availability and overtime limits mean the baseline you're measuring against is accurate from the start.
Every schedule still gets your approval before it publishes, so you keep full control over quality while Heyhive handles the heavy lifting of building shifts that already account for certifications and availability. That combination, accurate baseline plus live tracking, is what turns adherence from a lagging report into a same-shift recovery tool. If your current setup can't tell you who's out of adherence until the next morning, that gap is costing you service level every single week.
Start a free trial with Heyhive and see your first AI-generated schedule alongside live attendance tracking within minutes.
Sources
For deeper configuration detail beyond this guide, these sources cover the technical and operational specifics supervisors run into most often: