
Sales per labor hour (SPLH) = total sales ÷ total labor hours worked in the same timeframe. That single formula tells you how much revenue each paid hour generates, and according to Black Box Intelligence, it's the go-to metric for assessing labor efficiency, optimizing staffing, and controlling labor costs. Quick-service restaurants typically target higher sales per labor hour, full-service casual operations generally target a moderate range, and retail varies widely by format and average transaction size.
The most immediate use of SPLH isn't just measurement. It's scheduling. Rearrange the formula and you get: Labor hours to schedule = Forecasted sales ÷ Target SPLH. That single rearrangement converts your sales forecast directly into a staffing plan, keeping labor percent on target before the week even starts.
Do this now: Pull last week's net sales from your POS and total paid hours from your timeclock export. Divide sales by hours. That number is your current SPLH baseline, and everything in this guide builds from it.
Key Takeaways
Sales per labor hour is the single most direct metric connecting your sales forecast to your staffing budget, and using it consistently is what separates reactive scheduling from demand-driven operations.
| Point | Details |
|---|---|
| Core formula | SPLH = Net sales ÷ Total paid labor hours; use actual timeclock data, not scheduled hours. |
| Set a business-specific target | Target SPLH = Average hourly wage ÷ Target labor %; adjust by daypart and season. |
| Benchmark by operation type | QSR typically targets $100–$250+; full-service casual $60–$100; retail $75–$200. |
| Pair with complementary KPIs | Track labor % of sales, check average, and turnover rate alongside SPLH to avoid blind spots. |
| Heyhive automates the workflow | Heyhive generates forecast-driven schedules, captures GPS-verified hours, and exports payroll-ready data to keep SPLH calculations accurate and consistent. |
Table of Contents
- What does sales per labor hour actually measure?
- How to calculate SPLH: three worked examples
- What's a good SPLH for your operation type?
- How to interpret your SPLH and act on it
- Practical ways to raise SPLH without hurting service
- Where to pull your sales and labor data
- What SPLH doesn't tell you (and what to use alongside it)
- A copy-ready SPLH tracking template
- How scheduling software supports your SPLH workflow
- Heyhive connects your SPLH targets to real schedules
- Sources
What does sales per labor hour actually measure?
SPLH is defined as total sales divided by total labor hours worked in the same period. Simple on the surface, but the inputs require precision.
Which sales figure to use
Use net sales from your POS report: gross sales minus voids, comps, and returns. Gift card redemptions count when the customer spends them (not when purchased). Discounts reduce the sale, so they're already reflected in net sales. Avoid using gross sales or including tax, since those inflate the numerator and make your SPLH look better than it is.
Which labor hours to include
CalculatorLib's SPLH calculator clarifies that the denominator should include all paid hours, both regular and overtime, for hourly employees. The metric is currency-agnostic and works across restaurants and retail as long as units stay consistent: sales in dollars, hours in decimal hours.
Whether to include salaried managers is a deliberate choice. The Restaurant HQ recommends excluding salaried hours when your goal is to measure and control hourly labor, since salaried costs don't flex with scheduling decisions. Including them distorts the metric for shift-level decisions. If you include salaried hours, document that choice and apply it consistently.
| Component | Definition | Recommended source |
|---|---|---|
| Net sales | Gross sales minus voids, comps, returns, tax | POS daily/shift sales report |
| Total paid hours | Regular + overtime hours for hourly staff | Timeclock export or payroll report |
| Salaried hours | Include only if measuring total labor overhead | Payroll system (flag separately) |
| Target SPLH | Average wage ÷ Target labor % | Calculated from payroll + P&L targets |
Common calculation choices and trade-offs:
- Scheduled vs. paid hours: Scheduled hours are easy to pull but often wrong. Employees clock in late, leave early, or pick up extra time. Always use actual paid hours for accurate SPLH.
- Including tips: Tips paid by the employer (tip pools, tip credits) affect wage cost but not SPLH directly. SPLH measures revenue per hour, not profit per hour. Track tips separately in your labor cost percent.
- Shift-level vs. weekly: Weekly SPLH smooths out daily swings. Shift-level SPLH reveals exactly when you're over- or under-staffed.
Pro Tip: Set up two SPLH columns in your tracking sheet: one for hourly-only labor and one including salaried. Run both weekly for 30 days. The gap between them tells you how much overhead your salaried staff adds per revenue dollar.
How to calculate SPLH: three worked examples
Calculator Academy confirms the core formula and its scheduling rearrangement. Here's how it plays out across three real operation types.
Example 1: Quick-service restaurant (single shift)
- Pull the lunch shift POS report: a certain amount of net sales
- Export timeclock data for that shift: relevant labor hours
- Calculate sales divided by labor hours for SPLH
- Compare to your quick-service restaurant target: evaluate labor efficiency and watch for service gaps.
Example 2: Full-service casual restaurant (full day)
- Net sales for Saturday: a given sales figure
- Total paid hours across all hourly staff: the total labor hours
- Calculate sales divided by labor hours for SPLH
- This falls within a typical benchmark range for full-service casual. Higher average check per table can improve this metric without increasing hours.
Example 3: Retail store (promotional week)
- Net sales for the week (excluding returns): a given sales amount
- Total paid hours for all staff: total labor hours
- Calculate sales divided by labor hours for SPLH
- This may reflect a promotional lift. Compare to non-promotional periods to evaluate staffing efficiency.
Spreadsheet formulas to paste directly:
- SPLH:
=B2/C2(where B2 = net sales, C2 = total labor hours) - Labor hours to schedule:
=B2/D2(where D2 = target SPLH) - Variance vs. target:
=E2-D2(where E2 = actual SPLH, D2 = target)
Labor is consistently one of the largest controllable expenses in the restaurant industry, which is why the National Restaurant Association's research frames SPLH as a core operational KPI, not a nice-to-have reporting metric.
What's a good SPLH for your operation type?
Benchmark ranges give you a starting point, but your target SPLH should come from your own wage structure and P&L goals, not an industry average alone.
Industry benchmark ranges
The Restaurant HQ's SPLH guide provides the following reference ranges by operation type:
| Operation type | Typical SPLH ranges | Key driver |
|---|---|---|
| Quick-service restaurant | Generally higher targets typical of fast operations | High volume, low ticket, fast turns |
| Fast-casual | Moderate SPLH targets depending on service style | Counter service, moderate ticket |
| Full-service casual | Lower SPLH targets consistent with table service | Table service, higher ticket, more staff |
| Fine dining | Typically lower SPLH due to service style and labor intensity | Lower covers, high ticket, high labor |
| Bars / high-margin beverage | Generally higher SPLH because of liquor margins | Liquor margins offset lower cover counts |
| General retail | Wide variation depending on format and traffic | Varies by format, transaction size, traffic |
Fine dining looks low, but that's expected: more staff per table, longer service times, and higher ticket averages mean the revenue-per-hour figure is naturally compressed. The metric still matters for controlling costs; the target just sits lower.
How to set your own target SPLH
Use this formula: Target SPLH = Average hourly wage ÷ Target labor %
That's the minimum revenue each labor hour needs to generate to hit your cost goal.
Adjust for context:
- Seasonality: Lower targets in slow months, higher in peak periods.
- Daypart: Lunch may carry a $120 target; a slow mid-afternoon might realistically sit at $60.
- Store size: Larger footprints require more coverage labor regardless of sales volume.
Pro Tip: Set daypart-level SPLH targets, not just weekly ones. A weekly average of $90 can mask a breakfast shift running at $40 and a dinner shift at $140. Daypart targets let you staff each window correctly instead of averaging the problem away.
How to interpret your SPLH and act on it
Knowing your SPLH number is only useful if you know what to do with it. Compare actual SPLH to your target and place yourself in one of three bands.
The three action bands
- Below target (actual SPLH < target SPLH): You're generating less revenue per labor hour than your cost structure requires. Either sales are lower than forecast, you're overstaffed, or both. Act on the schedule first.
- On target (within 10% of target SPLH): Labor and sales are aligned. Monitor for service quality signals; don't cut hours just to push the number higher.
- Above target (actual SPLH significantly > target SPLH): Revenue per hour is strong, but check whether you're understaffed. High SPLH with declining customer satisfaction or longer wait times is a warning sign, not a win.
Translating SPLH gaps into schedule changes
When SPLH is low, the fastest fixes are role-based. Reassign support tasks (side work, restocking, cleaning) to slower dayparts so peak hours run leaner. Adjust opening and closing coverage to match actual traffic rather than habit. Shift overlap periods, where two full crews are on simultaneously, are common culprits.

Example workflow: A full-service restaurant runs $58 SPLH against a $70 target on Tuesday lunch. The manager pulls the timeclock and finds three servers clocked in for a shift that historically needs two. The fix: reduce Tuesday lunch to two servers, assign the third to a Thursday dinner where SPLH is $95 and a third server would improve table turns.
When SPLH is low, act on these first:
- Cut shift overlaps by 30 minutes at open and close
- Reassign one support role to a higher-volume daypart
- Check whether a slow daypart can be covered by one fewer person without service impact
When SPLH is high, check these before celebrating:
- Review customer wait times and complaint logs
- Look at ticket times and table turn data
- Ask whether the high number reflects a sales spike or a staffing gap
Practical ways to raise SPLH without hurting service
Lifting SPLH is about generating more revenue per hour worked, reducing unnecessary hours, or both. The tactics below are ranked from fastest to implement to longest lead time.
Quick wins (this week)
- Tighten shift start and end times. If your POS shows sales dropping after 8:30 PM, closing staff at 9:00 PM instead of 9:30 PM saves 30 minutes per person.
- Coach upselling at the point of order. A server who adds one $8 appetizer per table on a 40-cover shift adds $320 in sales with zero additional labor hours.
- Eliminate unnecessary overlap. Audit your schedule for 15-to-30-minute overlap windows where two shifts run simultaneously. Cut them where traffic data doesn't justify them.
Medium-term moves (next 30–60 days)
- Cross-train staff for dual roles. A cashier who can also stock shelves or a server who can run the bar during slow periods reduces the minimum headcount needed to open.
- Build daypart-specific staffing templates. Use your SPLH history to create a Monday lunch template, a Friday dinner template, and so on. Demand-driven scheduling built from actual sales patterns keeps labor aligned to revenue automatically.
Longer-term investments (60–90 days)
- Adjust your menu or assortment for labor efficiency. High-labor, low-margin items drag SPLH down. A menu audit that removes two slow-prep items can lift kitchen SPLH without adding a single hour.
- Implement labor forecasting from sales history. Sales-based scheduling tools that pull POS data and generate hour recommendations remove the guesswork from weekly planning.
Pro Tip: Before rolling out a scheduling change across all locations or all shifts, run it as a single-store or single-day pilot. Track SPLH alongside service indicators like tickets per labor hour and check average. A change that lifts SPLH while dropping check average isn't a win.
Where to pull your sales and labor data
Accurate SPLH starts with aligned data. Using the wrong report, or mismatching timeframes, produces a number that looks precise but means nothing.
Your authoritative data sources
- Timeclock export: — This is your labor hours source, not the schedule. The Restaurant HQ's SPLH guide flags using scheduled hours instead of actual paid hours as one of the most common miscalculation errors.
Alignment steps
- Match the exact timeframe: if your POS report covers Monday 6 AM to Sunday 11 PM, your timeclock export must cover the same window.
- Exclude salaried hours from the denominator unless you're intentionally measuring total labor overhead.
- Remove comped sales from net sales if your POS doesn't do it automatically.
- Flag overtime hours separately so you can see when overtime is inflating your labor cost without proportionally lifting sales.
Accurate time tracking is the foundation of reliable SPLH. A timeclock that rounds to the nearest quarter-hour can introduce meaningful error across a 40-person team over a week.
Common pitfalls and fixes:
- Pitfall: Using the printed schedule instead of actual clock-out data. Fix: Always export from the timeclock system, not the scheduling tool.
- Pitfall: Including gift card sales at purchase rather than redemption. Fix: Configure your POS to report redemptions only.
- Pitfall: Forgetting to remove returned items from weekly sales. Fix: Run a net sales report, not a gross transactions report.
What SPLH doesn't tell you (and what to use alongside it)
SPLH is a powerful metric, but it answers one question: how much revenue did each labor hour generate? It does not answer whether that labor was fairly compensated, whether guests were satisfied, or whether your team is burning out.
SPLH blind spots:
- Ignores wage rates entirely. A $200 SPLH at $22/hour average wage costs more than a $180 SPLH at $14/hour. SPLH alone won't catch that.
- Hides understaffing. A team running short-staffed can produce a high SPLH for a few weeks before service quality drops and sales follow. High SPLH is not always a sign of efficiency.
- Misses non-sales work. Cleaning, training, prep, and administrative tasks consume labor hours without generating sales. SPLH treats those hours the same as revenue-generating ones.
- Averages out inequality. A weekly SPLH of $90 can mask a $40 breakfast and a $140 dinner running simultaneously.
Using SPLH as your only staffing input is like navigating with one instrument. It tells you speed, not direction. Pair it with labor percent of sales to understand cost, check average to understand revenue quality, and turnover rate to understand whether your staffing decisions are sustainable for your team.
Complementary KPIs to track alongside SPLH:
- Labor % of sales: (Total labor cost ÷ Net sales) × 100. Captures wage rates that SPLH ignores.
- Items per labor hour: Useful in retail and QSR for measuring throughput independent of price.
- Check average: Tracks revenue quality. Rising SPLH with falling check average may mean you're rushing guests.
- Employee turnover rate: A lagging indicator of whether your scheduling decisions are sustainable.
A copy-ready SPLH tracking template
You don't need specialized software to start tracking SPLH. This template works in Excel or Google Sheets. Copy the column headers and paste your data.
| Field | Description | Formula / source |
|---|---|---|
| Date | Shift or day date | Manual entry |
| Daypart | Breakfast / Lunch / Dinner / Full day | Manual entry |
| Net sales ($) | From POS net sales report | POS export |
| Labor hours | Total paid hours from timeclock | Timeclock export |
| SPLH | Net sales ÷ Labor hours | =C2/D2 |
| Target SPLH | Set from wage ÷ labor % target | Manual entry |
| Variance | Actual SPLH minus target SPLH | =E2-F2 |
Validation checklist before you calculate
- Confirm net sales is positive and non-zero for every row.
- Confirm labor hours is greater than zero for every row.
- Check for outliers: any SPLH above 3× your typical range likely signals a data entry error or a missing labor export.
- Verify the POS timeframe and timeclock timeframe match exactly.
- Confirm salaried hours are excluded (or consistently included, if that's your choice).
- Remove any rows where the store was closed or sales were zero due to a system outage.
You'll spot problem shifts at a glance without scanning every row.*
How scheduling software supports your SPLH workflow
Manual SPLH tracking works, but it breaks down at scale. When you're managing multiple locations, multiple dayparts, and a team that swaps shifts, the data alignment problem becomes the bottleneck.
The features that matter most for SPLH-driven operations:
- Automated labor forecasting from sales history: Pulls POS data and generates recommended hours by daypart, removing the manual step of dividing forecasted sales by target SPLH.
- Daypart-level scheduling templates: Pre-built shift structures for each day and time window, calibrated to your SPLH targets.
- Real-time labor vs. sales dashboards: Shows actual SPLH as the shift progresses, so managers can adjust coverage before the day ends.
- GPS-verified time clock exports: Eliminates the gap between scheduled and paid hours by capturing exact clock-in and clock-out times, including for field and multi-site teams. GPS time clock tools make this data reliable enough to feed directly into SPLH calculations.
- Payroll-ready hour exports: Sends verified hours directly to payroll, reducing manual reconciliation and the errors it introduces.
- Open-shift coverage tools: When an employee calls out, fast coverage prevents the unplanned labor gap that distorts your SPLH for the day.
Consider a manager running a fast-casual location during a two-week promotional period. With sales forecasting built into their scheduling tool, they set a target SPLH of $120 for the promotion window, let the system calculate recommended hours per daypart, and approved the generated schedule. Labor percent stayed within one point of target for the entire promotion.
Scheduling tools like 7shifts and TimeForge offer POS integrations and labor forecasting features designed specifically for this workflow. The key integration requirement is two-way data sync: POS sales data flows into the scheduling tool to inform forecasts, and timeclock data flows back out to payroll for accurate SPLH reporting. Without that sync, you're still reconciling spreadsheets manually.
The case for using SPLH wisely in 2026
SPLH is the most direct line between your sales forecast and your labor budget. That's its power. But the managers who get the most from it treat it as one input in a broader operating picture, not a single truth to optimize at all costs.
The temptation is to chase a high SPLH number by cutting hours. That works for a quarter. Then service slips, regulars notice, check averages drop, and the SPLH you were proud of starts to fall anyway because the sales side of the equation erodes. The metric didn't lie; it just didn't tell the whole story.
Track SPLH at the daypart level, set targets from your actual wage structure, and pair it with labor percent and customer satisfaction data. When those three signals point in the same direction, you have a real picture of operational health. When they diverge, that's where the interesting management work begins.
Heyhive connects your SPLH targets to real schedules
Calculating SPLH manually is a start. Acting on it consistently, across every shift and every location, is where most managers hit a wall.
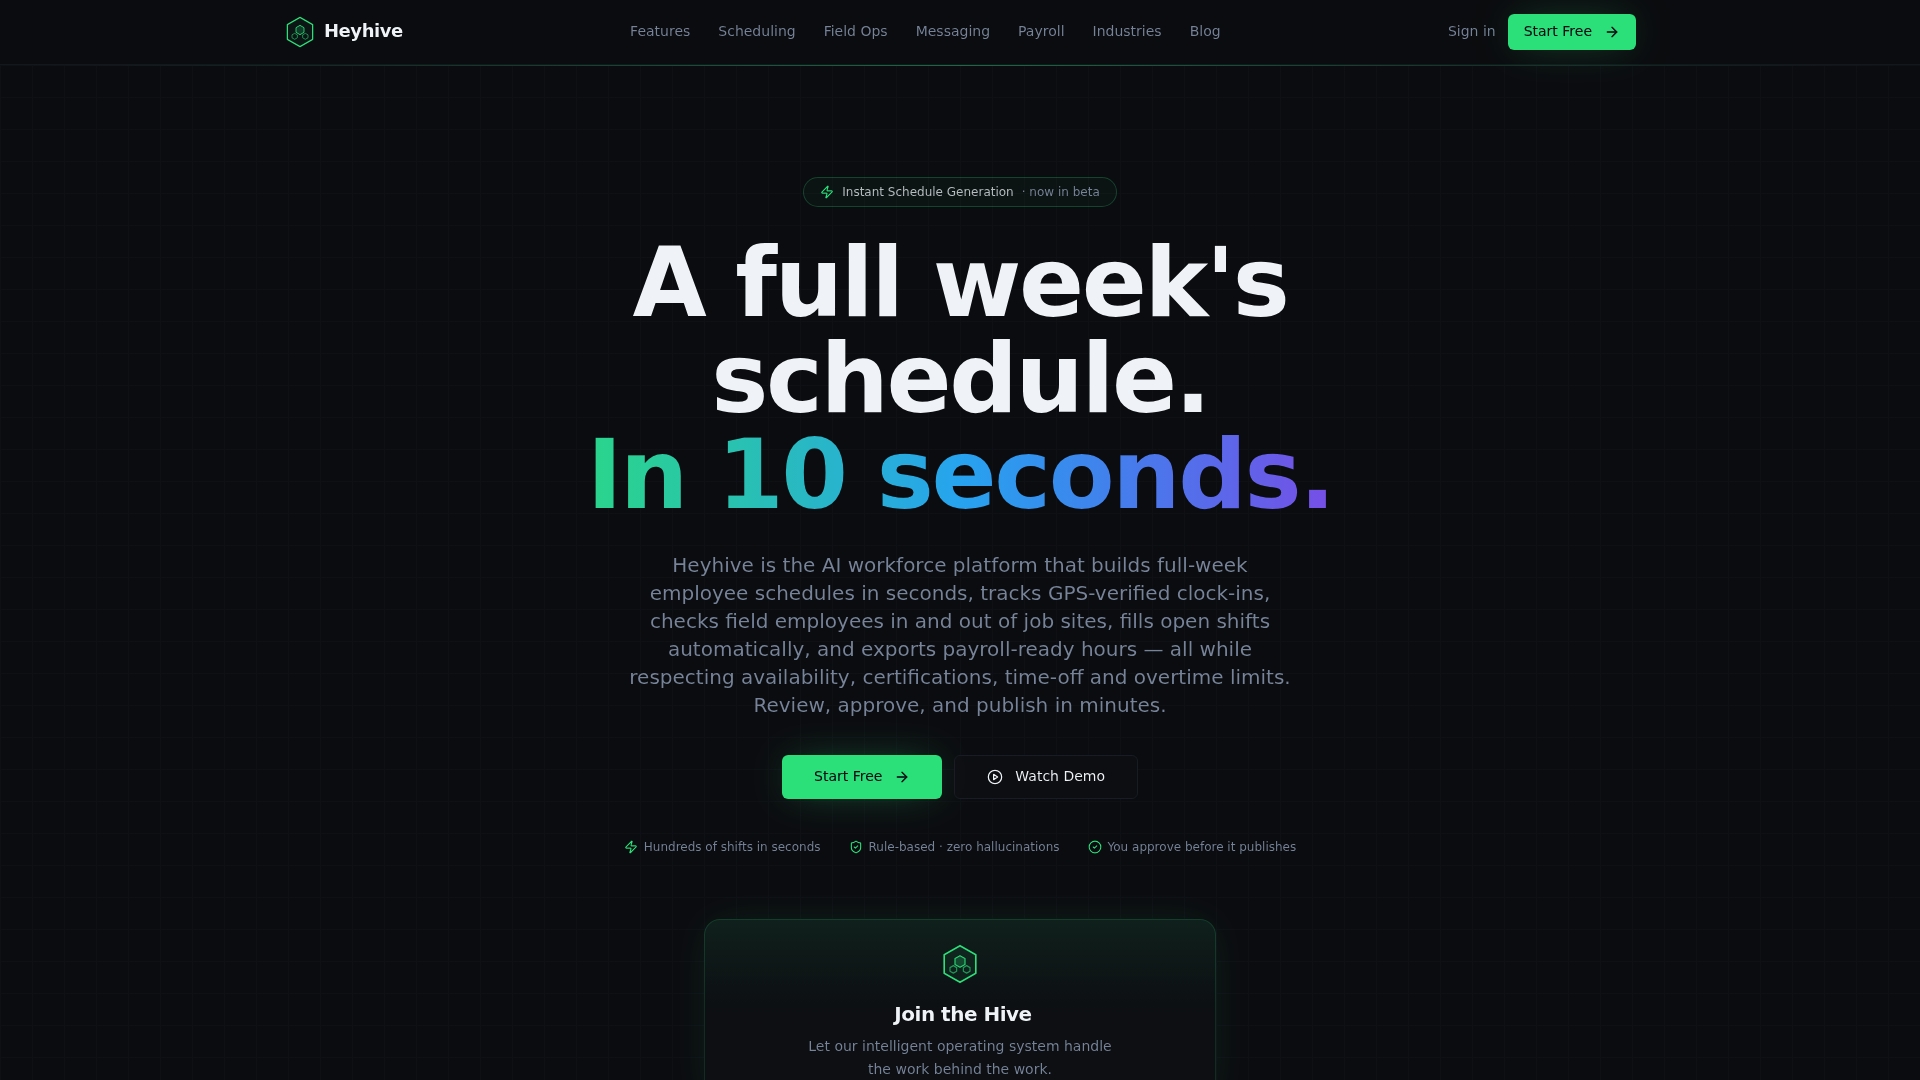
Heyhive's AI scheduling platform generates full weeks of shifts in seconds, built directly from your sales forecasts and SPLH targets. You set the target, Heyhive calculates the hours, and you approve the schedule before it goes live. GPS-verified clock-ins feed accurate paid hours back into your reporting, so your SPLH calculations reflect what actually happened, not what was planned. When a shift goes uncovered, open-shift tools surface available staff fast, protecting your labor efficiency without a scramble.
Restaurant scheduling and retail operations both benefit from the same core workflow: forecast-driven hours, verified time data, and payroll-ready exports that close the loop. Start a free trial at Useheyhive and see how quickly your SPLH tracking moves from a spreadsheet exercise to an automated part of your weekly operations.
Sources
- Sales Per Labor Hour (SPLH) - Restaurant Glossary
- SPLH Definition, Formula, And How To Use It
- Sales Per Labor Hour - Calculator Academy